Semi-quantitative Risk Analysis – An OHS Leading Indicator
Kevin Lehner

May 25, 2021
Introduction
OHS Managers need to find good ways to predict and influence future OHS performance. These predictors of OHS performance are refed to as "leading indicators". Semi-quantitative OHS risk analysis is now being recognized as a good leading indicator of OHS performance.. This article describes how semi-quantitative risk analysis is used as a leading indicator of OHS performance.
Risk is defined many ways. Some say risk is the combined effect of the likelihood of something happening and its severity or consequence. Others say that risk is the "effect of uncertainty". Some prefer the definition "risk is the effect of uncertainty on objectives". OHS risk is an important part of overall Enterprise Risk Management (ERM). OHS risk managers need to communicate risk in ways that help the organizations leadership understand how OHS risk affects the organization's ability to achieve its overall business objectives.

Leading vs Lagging Indicators
Historically OHS performance information has been communicated to leadership through lagging indicators like the number of injuries per the amout of time worked. The difference between leading and lagging indicators is lagging indicators measure the occurrence and frequency of events that occurred in the past, such as the number or rate of injuries, illnesses, and fatalities. Leading indicators help risk managers understand if safety and health activities are effective at preventing incidents. A good safety and health program uses leading indicators to drive change and lagging indicators to measure effectiveness.
Using Leading Indicators to Improve Safety and Health Outcomes published in 2019 by the US Department of Labor mentions risk analysis (assessment) as one possible measure of future OHS performance. A key recommendation of the Department of Labor article is:
“Identify your top problem areas. For hazards, review your injury logs, and results from your hazard assessments. Start with the hazard that has the greatest risk of harming workers by evaluating the severity of the potential exposure and the likelihood that an incident could occur. Prioritize hazards over other areas of your program, particularly if a threat is imminent.”
Quote from US Department of Labor Leading indicators article.
ISO 45001 and ISO 31000
The International Organization of Standardization (ISO) has developed an OHS Management System Standard (OHSMS), ISO 45001:2018 that can be used as a model by organizations that want to continually improve their OHS performance. ISO 45001 encourages organizations to identify the "risks and opportunities that need to be addressed". However ISO 45001 does not specify how organizations should determine which risks and opportunities need to be addressed.
Other ISO documents can help provides guidance on risk management techniques. One of these is ISO 31000:2018 Risk management — Guidelines. Another good reference for specific risk assessment techniques applicable to OHS performance is ISO 31010 :2019 Risk management — Risk assessment techniques,
The ISO 31000 guidance can also be adapted to other discipline specific sustainability risks such as quality management and environmental management in addition to OHS. The semi-quantitative risk analysis approaches in 31010 can be used to help demonstrate conformance with the requirements of ISO 45001:2018 in the following clauses.
- 6 Planning,
- 8 Operational Control,
- 9 Performance Evaluation and
- 10 Continual Improvement.
Risk Relationships
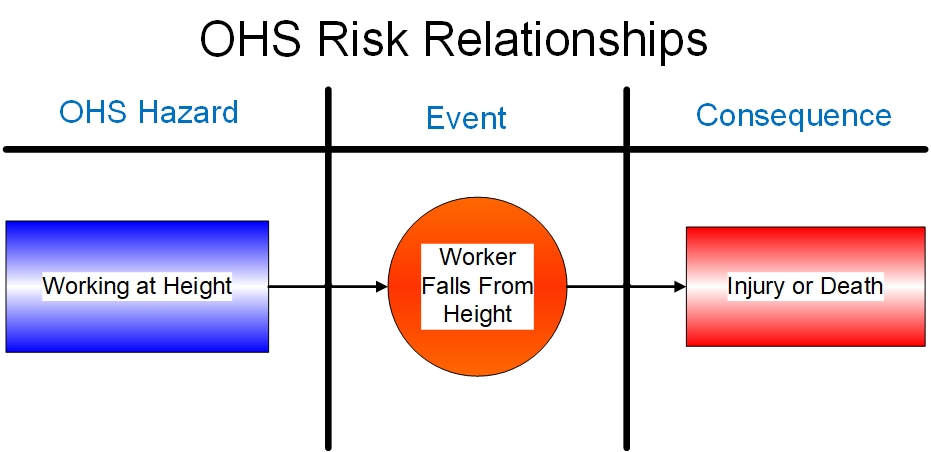
OHS risk management is based on the idea that "hazards" exist that can negatively affect an organization’s OHS performance. When these hazards are associated with an event employee injury may be the result. Figure 1 shows the relationship between hazards, events, and consequences. OHS risk is an estimate of how likely the hazard event is to happen and how bad the consequence is if the event occurs.
Hazard Identification
OHS risk analysis begins by preparing an inventory of the potential hazards, events and consequences. This work should be performed systematically by a group of people familiar with the processes and activities being assessed. The inventory can use process flow diagrams to help guide the group as it documents the process hazards. Figure 2 is a simplified example of a process diagram for making cake. Each step in the process is likely to have more hazards that could be identified.
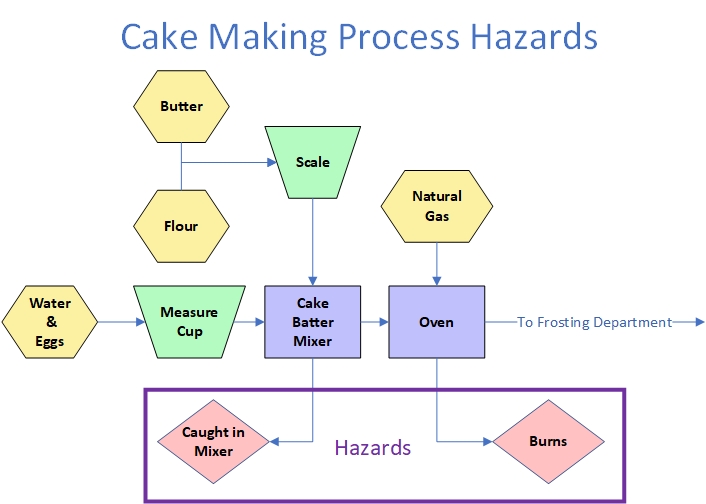
Non-linear process, such as maintenance activities can use brainstorming approach to identify hazards. The results of the hazard inventory should be documented for use in the next step of the risk analysis process.
Calculating Risk and Determining Risk Categories
The likelihood of the hazard event occurring and the severity of the consequence of the event can be estimated by those familiar with the process and the hazard event. A risk analysis matrix can help provide an estimate of the risk the hazard event presents to the organization. Figure 3 is an example Risk Matrix (5 x 5) used to calculate the relative risk of a hazard event.
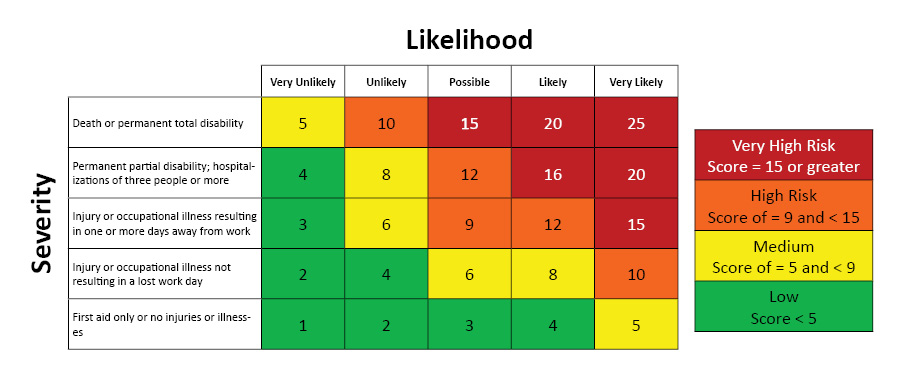
The vertical axis of the matrix has 5 increasing levels of hazard event severity. The horizontal access has another 5 levels of hazard event likelihood. By estimating the likelihood of the hazard event occurring and the associated severity of the event, a risk level can be computed by multiplying those two values. Risk levels can also be identified such as very high or low as depicted to the right of the risk matrix. These risk levels are usually established with the input of leadership with input by workers. The action the organization takes to address the risk levels is also determined by leadership with input from workers.
Calculating risk and establishing risk levels is not an exact science. It is based on subjective judgement of knowledgeable persons including workers estimating the likelihood and severity of a hazard event. But if the risk assessment limitations are understood, the results of the risk assessment can be used to identify and address risks that are unacceptable to the organization. This is referred to as risk treatment or risk management..
Prioritizing Risk for Treatment
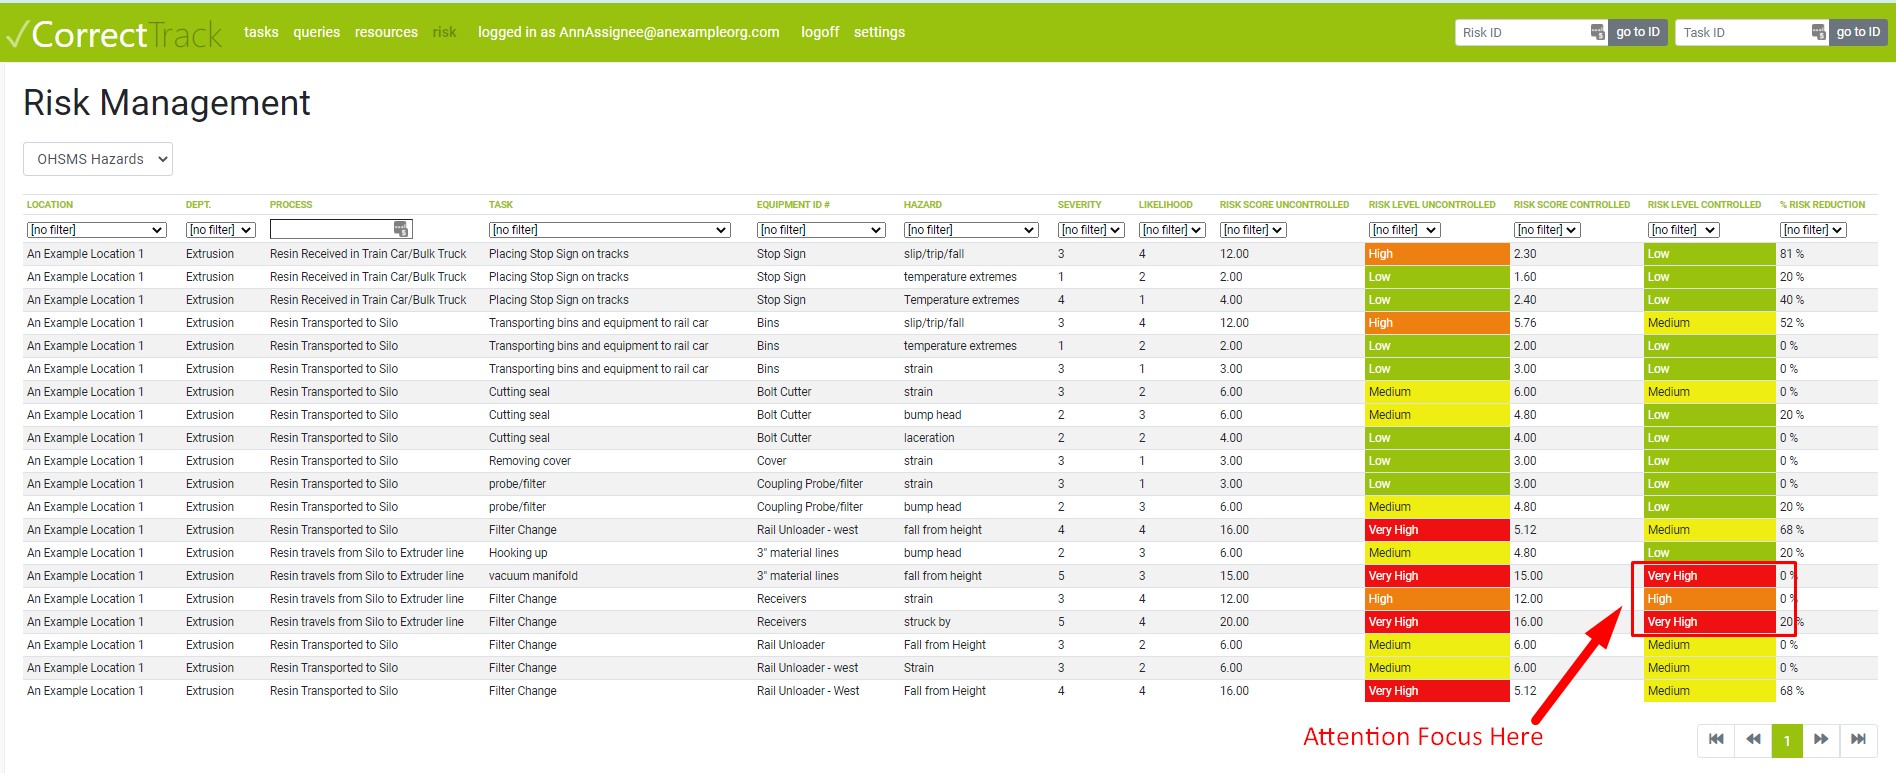
When hazard event risk scores are estimated and calculated they can then be used to help prioritize which needs to be addressed and in what order. Spreadsheets and databases like CorrectTrack can be useful tools when calculating risk values and setting priorities. Figure 4 shows how a database can help prioritize and focus attention
Treating OHS Risk with the Hierarchy of Control
OHS Risk scores of higher-ranking hazard events can be reduced through actions to treat the risk. These treatments reduce the likelihood of the hazard event occurring and/or reduce the severity of the event consequence. Risk treatments are often referred to risk controls. The most effective control in the HOC is elimination of the hazard. Risk reduction can be calculated using the Hierarchy of Control (HOC) protection factors shown in Figure 5.
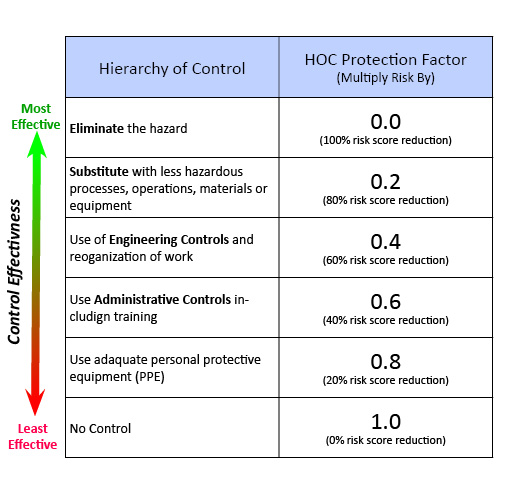
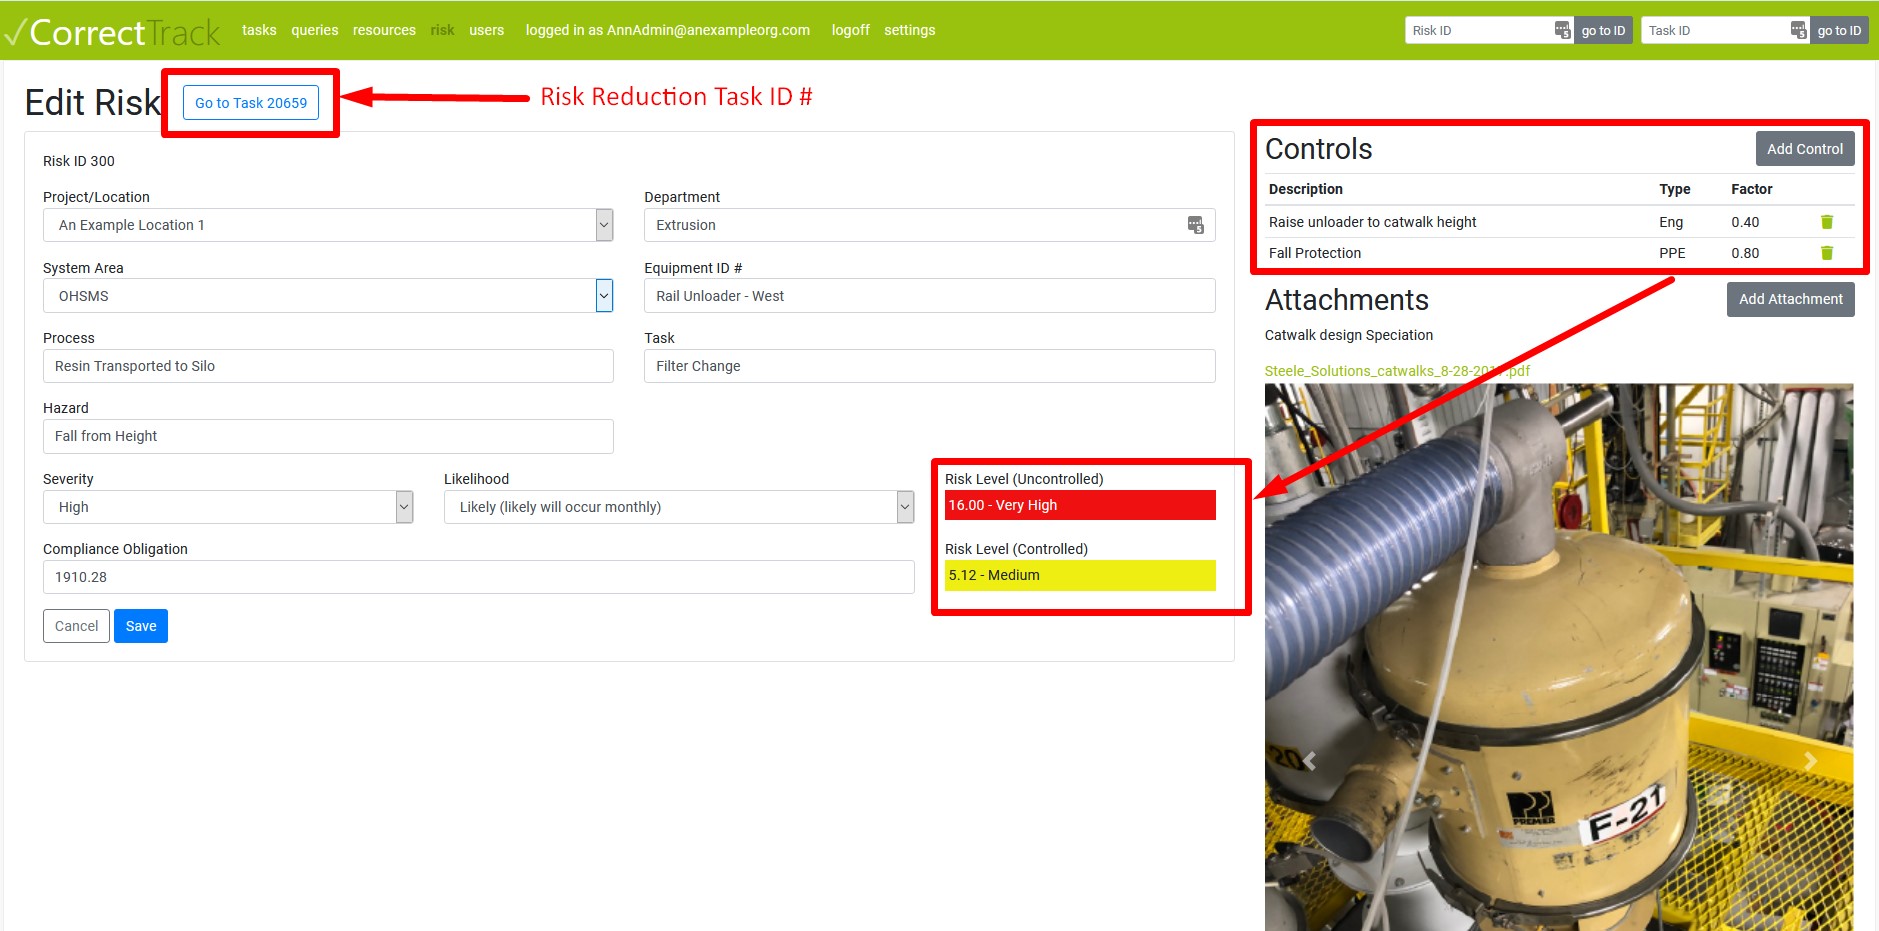
Eliminating the hazard event offers a 100% reduction (multiply risk score by 0) because the hazard no longer exists. As you move down the HOC, controls become less effective or reliable in treating the hazard event risk. Administrative controls provide only a 40% protection factor and so on. Multiple controls can be applied that results in additional risk score reduction. These are sometimes referred to as Layers of Protection”. Figure 6 shows how a database application like CorrectTrack can be used to calculate hazard event risk reduction.
Identifying, Implementing and Verifying Risk Control
Identifying potential controls to reduce risk is like processes used for corrective action of nonconformities discovered in management system or other audits. Teams including workers and leadership should investigate and determine effective controls that will reduce the risk to a level the organization considers acceptable.
Once the control(s) are identified the team should create a project implementation timeline. Progress of the project should be monitored to ensure the control is implemented in a timely fashion. When the team agrees that the control implementation project is complete a team member should be appointed to verify that the control was implemented as planned and that it is effective in controlling risk as designed.
Periodically checking the control
The new control(s) should be added to a periodic internal audit schedule to confirm it remains effective. Results of the audits should be documented and reviewed by leadership. But, if audits show that the control is no longer effective or less effective than expected the hazard risk score should be reviewed and revised as appropriate,
Conclusion
Semi-quantitative risk analysis can be used as a leading indicator of OHS performance. The results of the risk analysis can be used in conjunction with the Hierarchy of Control to calculate how much the risk level is reduced by the control or treatment.